
With abcpos, you have full access to real-time reporting.
Part 1.
The report section allows you to generate XLS and CSV Files for data analysis. You are able to see an Overview, Sales, Product, Payment, Inventory, Customer, Employee, and Gift Card in this Report Section.
You can filter the report by branches, different time periods, and also you can print and export the detailed report files from each module.
Part 2. Accessing with your Abc Dashboard account
Go to Dashboard and log in with your user account. Only users with permission have access to the Report Section, you may contact the administrator or business owner to request access. If you are the administrator and you do not know how to set up the permissions. Please check this article: User account.
Part 3. Report Overview
The overview page gives you a quick overview of Sales, Payment, and Product. Before you start browsing, try this:
● Filtering Reports
There are different types of filters that depend on the type of report you're viewing.
- Branches: If you have more than one location, you can select one or all locations to run a report. Tap the top right “All Branches” drop-down and select one of them.
- Time Period:
 Tap “Daily, Monthly, Yearly”, then Tap the date to select from the calendar.
 - More
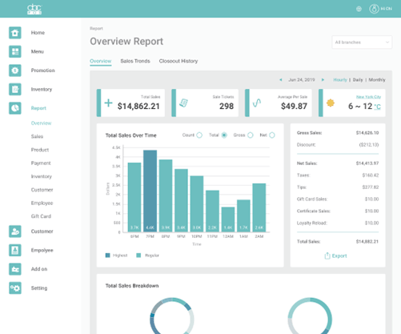
3.1. Overview
- Quick view
It shows 4 quick-view columns: Total Sales, Sale Tickets, Average Per Sale, and Weather. - Summary: It shows a summary of the day/date range selected and it shows a detailed calculation of Total Sales amount for Gross sales, Discount, Net Sale, Tax... e.g. You are able to click “Export” to export the file.
- Top Selling Products
It shows 5 top-selling products. The item name is shown on top, sales on the left, and amount on the right. Switching between count&sales to have a different top list (top sales or top number sold)
- Exporting / Printing the Daily Sales Details
In the Overview tab, select a date form the time period bar→ Scroll down to “Daily Sales Details” → Tap the “Export” or “Print ”button to continue. - Branch Invoice Details
This section only shows when One selected branch and Date is selected.
Step 1. Select a branch from the top-right dropdown
Step 2. Scroll down to “Branch Invoices Details” section
- Viewing & Searching for an invoice/order on Dashboard
- By Hourly:
When a branch and a date is selected, clicking an hour in the bar chart shows this table of all orders created in the branch within the hour. - By Order Number:
Enter the Order number, and it filters the orders you look for. Click and view the order detail.
- By Hourly:
- Clicking an invoice from Branches Invoices Details and shows the order details in a popup.
- Click anywhere outside the modal closes this view.
- Exporting/ Printing the Branch Invoices/ Orders by tapping the “Export” or “Print” button.
3.2. Sales Trends
- “Sales Trends” shows and provides a comparison for Weathers, Total sales and Sales Categories, and Average per sale on the selected 2 days.
- For the weather, you could select from the cities where the branch located. By default, it’s the city of your company address. You could also switch the temperature display between Celsius and Fahrenheit. If a branch is selected for this report (not “All branches”), the city option is limited to the city where the selected branch is in.
- “Total Sales” shows the total sales for each hour between the 2 days. You could also switch between sales tickets, total sales, gross sales, and net sales. On the top left, it shows the difference and ratio.
- Menu Category It shows the sales of the selected menu category. By default, the first menu category is selected and you could switch to a different category from the dropdown menu on the right-hand side.
3.3. Closeout history
In this section, it shows the closeout history same as the POS closeout report. Filtering the report by a selected date, shifts, report outlines. You can also export and print the report by clicking the “Export” or “Print” buttons.